
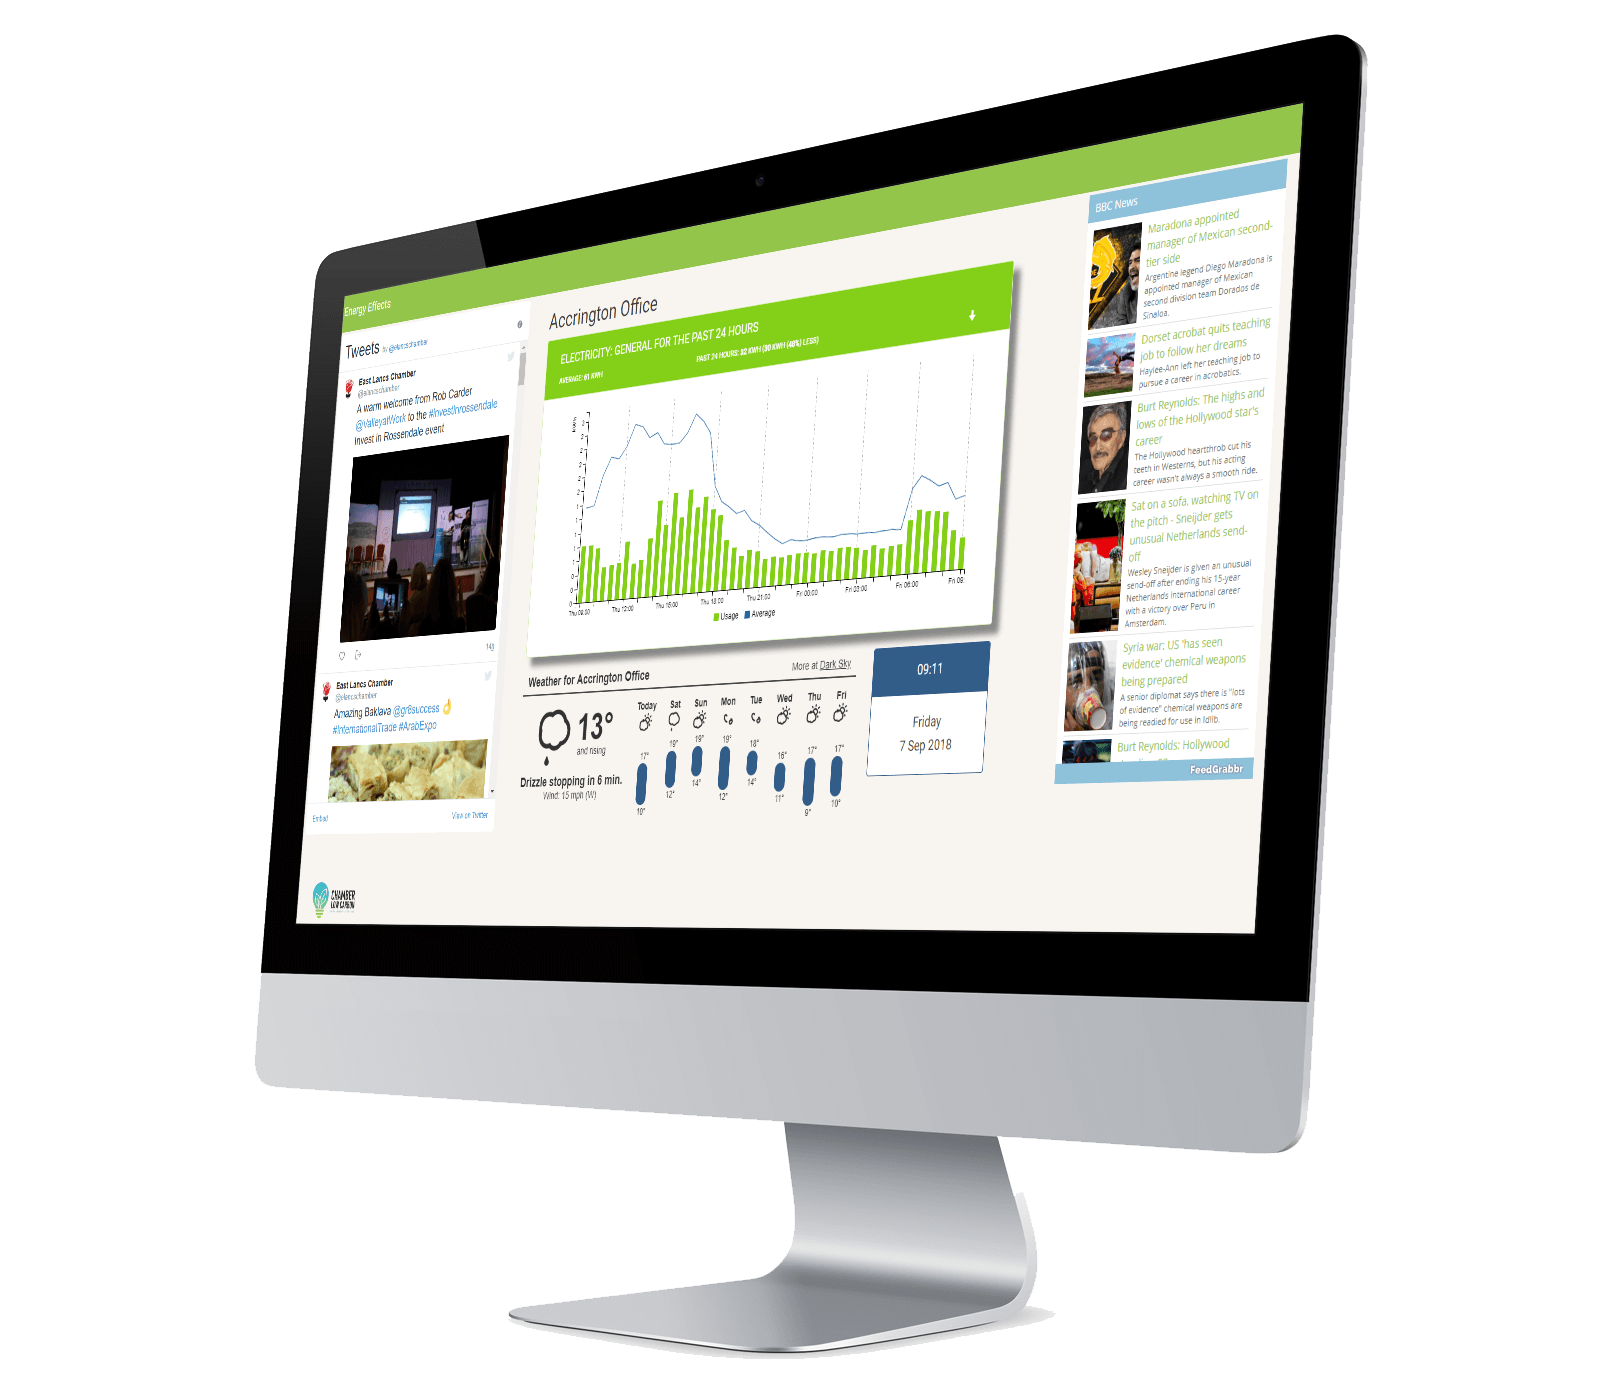
A dashboard can serve as a simple introduction to energy monitoring in an organisation just starting to take an interest in its carbon footprint. It is designed to take the information stored in an Energy Effects database and make key performance indicators visible without needing any interaction from the user. Running on a smart TV, typically located in a reception or staff area, the dashboard can include non-energy-related items, such as news and weather, to engage the interest of staff or visitors and promote awareness of energy usage.
The charts show consumption (the green bars) against a four-week average (the blue line) and are set to cycle through the types of consumption (Power/Lighting) and the areas (Ground Floor/First Floor/Ground Floor). Consumption is shown over the last 24 hours, the last 28 days and the last year.