
Energy Monitoring

Installing meters alone won’t save energy. However, a well thought out metering strategy will provide the data that is needed to make informed decisions based on when and where energy is being used. Data from our metering systems can be fed into our online software, which makes it available anywhere you have an internet connection – on a PC, tablet or smartphone.
After commissioning the meters, we would typically wait for a period of four to six weeks before presenting the software. This allows the system to build up some historical data, which makes the presentation more meaningful to users. The software has been designed to ‘humanise’ data, with the aim of minimising the need for training.
- Multiple utilities
- Dashboards
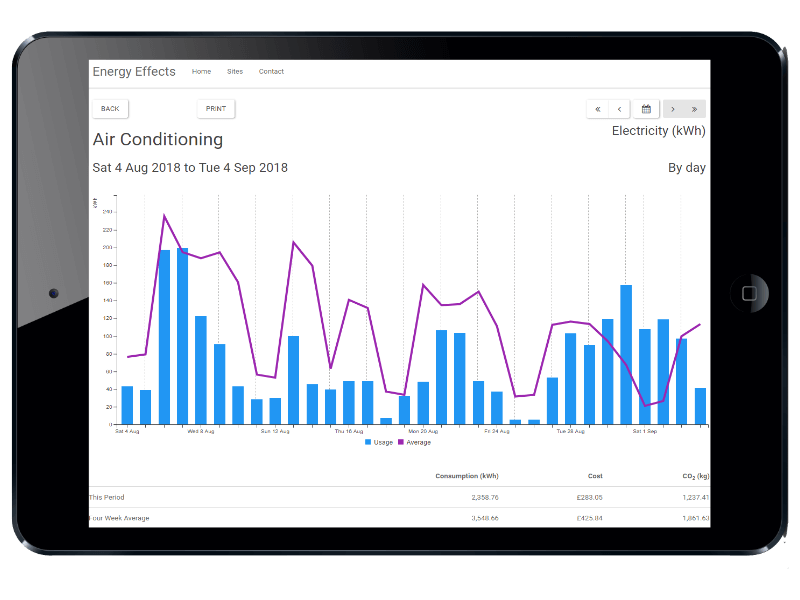
- Energy profiles
- Automated data import
- Tenant recharge
- Cloud-based
- Energy monitoring
- Identify waste
- Analysis and reporting
- Baseline calculation and reporting
- Data up to the last half hour
- Easy generation of tenant billing figures
- Breakdown by tenant
- Geographic breakdown
- Budget generation and reporting
- Breakdown by type of consumption
- Breakdown by type of consumption or area
- Optimise energy performance
- Identify potential maintenance issues
For a more interactive experience, our software allows you to choose how can view your data.
Our Software Can Be Used In 3 Ways, Ensuring Each Part of Your Business Benefits
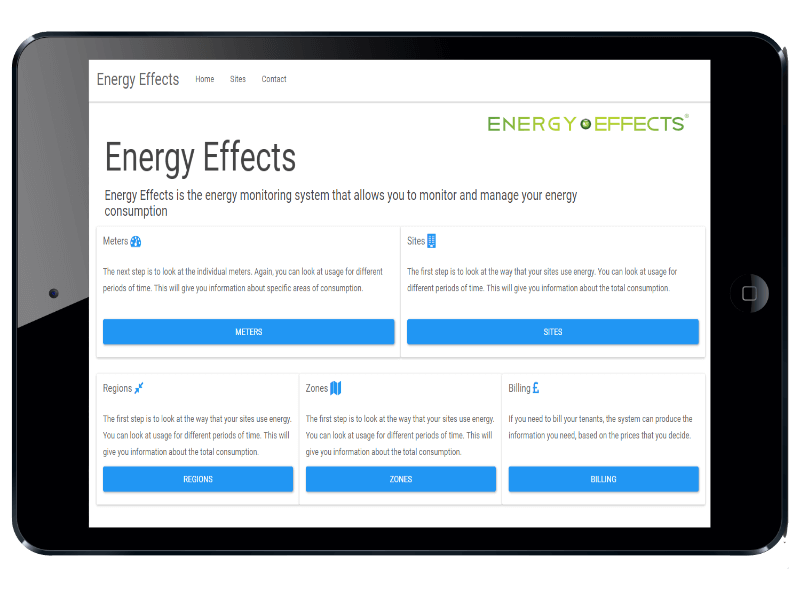
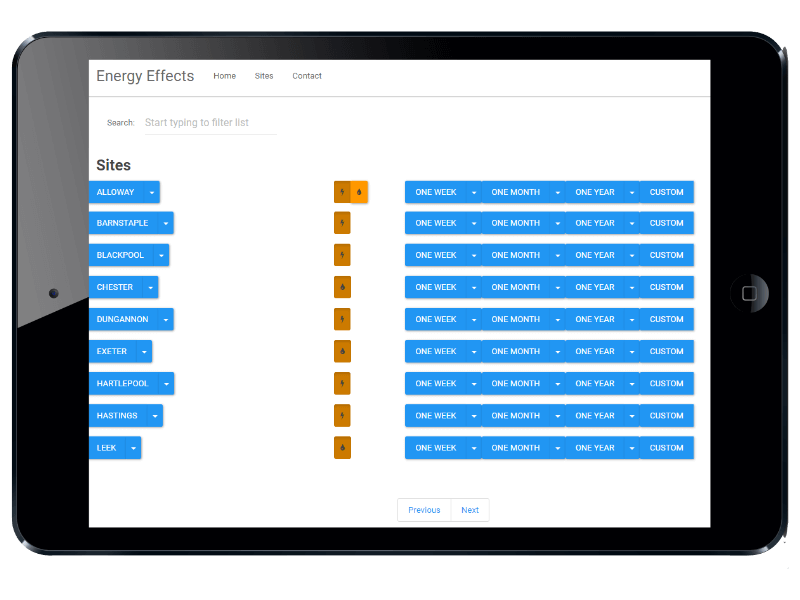
MANAGER
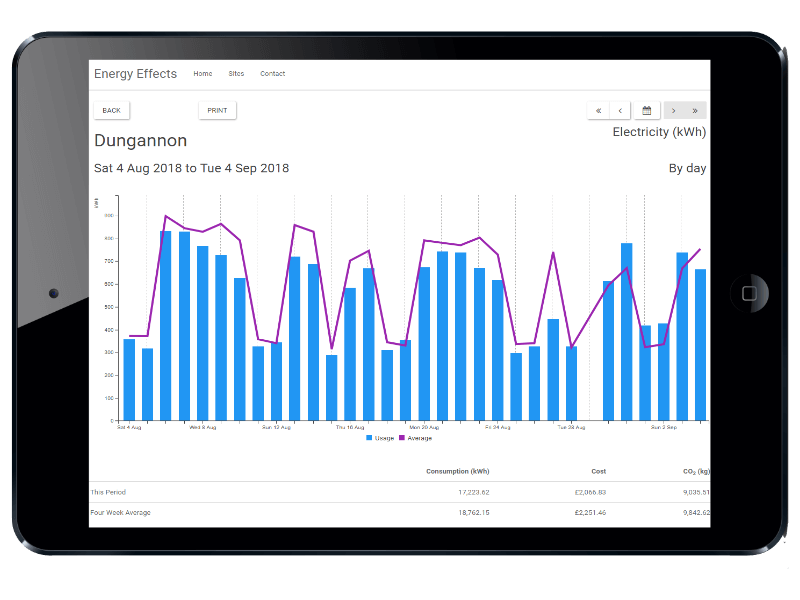
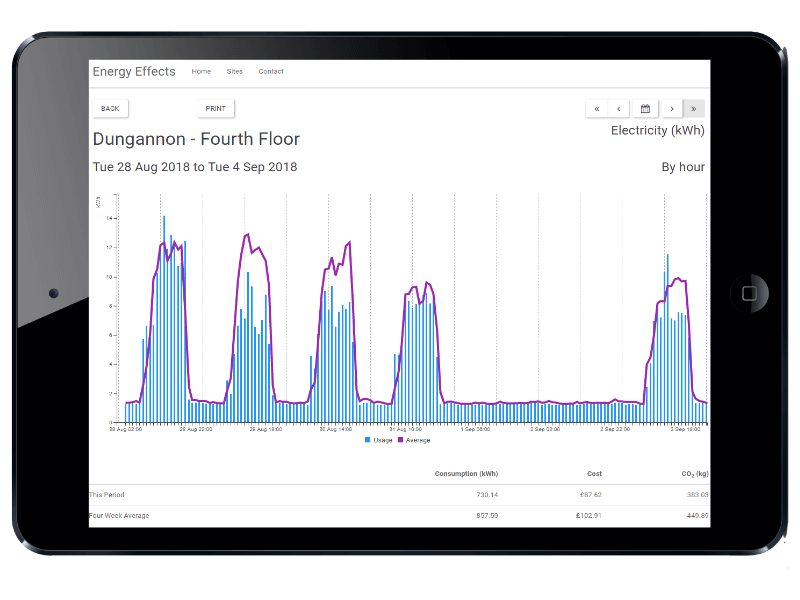
Manager is the intuitive front end for the systems. It has been designed to make information easy to reach without needing long training sessions. Energy profiles can be viewed over different periods of time. Where a client has many properties, these can be organised into zones and regions, allowing data from multiple sites to be aggregated.
DASHBOARD
A dashboard can serve as a simple introduction to energy monitoring in an organisation just starting to take an interest in its carbon footprint. It is designed to take the information stored in an Energy Effects database and make key performance indicators visible without needing any interaction from the user. Running on a smart TV, typically located in a reception or staff area, the dashboard can include non-energy-related items, such as news and weather, to engage the interest of staff or visitors and promote awareness of energy usage.
INSTANT
Where required, we can pull ‘right now’ data from our meters. Through our Energy Effects monitoring software we have developed a tool that allows clients to view their energy consumption by the second. This allows them to immediately see the effects of switching equipment on and off on their energy consumption, giving them the knowledge to make educated decisions about when and where to use electricity.